Wednesday, 16th July 2014

Oscillations is a very important phenomena in physics and has an extremely wide range of occurrences.

They are visible in the swinging and cushioning of cars or suspension bridges. In Nature, oscillation always occur as coupled ones.

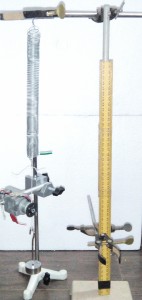
Today I started working on setting up an experiment with two spring pendulum to study oscillations of coupled pendulum. In this experiment we will try to get the characteristic frequencies and investigate the phenomenon of beat-vibration with two coupled spring pendulum.

Monday, 14th July 2014

Experiment to investigate the damping effect of air, water and other viscous liquids on spring oscillations can be very interesting if done with a computer interface. Currently these set-ups are available for very high cost and come with proprietary and  closed source software. They general use Rotary motion sensors which are costly.

Since yesterday I was working on this idea of setting up an experiment with low cost apparatus using ExpEYES. Tried using a simple DC motor to fetch the data and plot oscillations. ( we were using this method for digitizing pendulum waveform). After  multiple trials now the setup is ready and got amazing results.

The schematic diagram and my home made set up is here…… 🙂
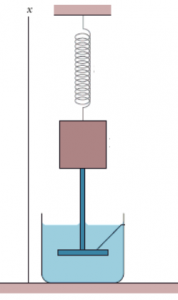
 springoscillations2damped ascillations

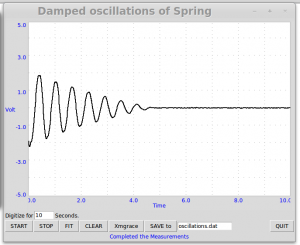
On release after being pulled down, a spring oscillates with decreasing amplitude due
to viscosity of liquid, and finally becomes stationary.  Here DC motor is our low cost rotary motion sensor… 🙂

Here is the screen-shot of the waveform generated in water. Tomorrow I will try this experiment with other liquids like glycerin.
damping

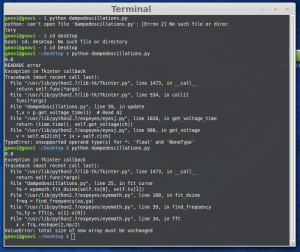
Some errors occurred while fitting the curve need to find out the problem.
 dampingerrors

Information from Hyperphysics was of great help

hyperphysics damping

The code is here….. (Used program for pendulum waveform with little modifications)
GSoC weekly Report 8

( From Monday 7th July 2014 to Sunday, 13th July 2014)

This week till 11th July 2014 I was in Montpellier, France, participated in Libre Software Meeting RMLL-2014.  Returned back today early in the morning.

This week I had experienced some good and some horrible things too.

The good things ….

  • I got to meet many people actively contributing to Free Software World.
  • Had interaction with Richard Stallman (RMS) of Free software Foundation. He was happy to see development of  ExpEYES.
  • I could spend some time with Georges who helped me with my GSoC project. We worked on GUI’s required for mechanics and sound Plugins. He also guided with packaging.

& The horrible things

  • Loosing my baggage in air travel….lost my acoustic and light  sensors, ExpEYES kit, A tablet  and other asccessories required for my ExpEYES experiments 🙁

………. Fortunately I have some extra ultrasonic sensors at home.


The only productive thing is that I could work on GUI’s for experiments with friction, Doppler Effect as I had data obtained from experiments that I did at home before leaving to France. As I am lagging behind my planned schedule I need to accelerate and work 24X7 this week so that I can finish documentation of all experiments and GUI’s by 20th of this month as planned.

GSoC Weekly Report 7

( From Monday 30th June 2014 to Sunday, 6th July 2014)This week was not so much productive since I was little busy in preparing for my travel to France for participating  in RMLL-2014 a free software conference. There I will be conducting a workshop on ExpEYES and will be giving a talk on  ” Exploring the phenomena of Sound and Electromagnetic Induction with ExpEYES”.

This week I continued to do the experimental with Doppler Effect using a pizzo buzzer as a source and a simple mic as a detector. Facing difficulties is calculating apparent frequency in case of oscillating source.

It is easy to calculate Doppler frequency shift in case of a source moving with constant velocity. Both the experimental setups are ready. Created a draft document for experimental procedures. Need to review and finalize the document. Also worked on the required python code to fetch data from detector and get the Doppler Shift.

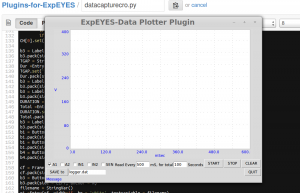
For accessing Data from all channels of ExpEYES we need a GUI which can plot graphs, something like a data logger. Today I started working on python code to develop a GUI to assess channels A1, A2, IN1, IN2 and SEN. Used the program written by Dr. Ajith Kumar as the base and started developing the code. Spent a lot of time …..happy that the result is awesome…..

datacapture


beatslike wave

With this GUI we can fetch data from any channel and save it to a dat file and see the plot in real time. It is time to forget all costly and closed source dataloggers…..ExpEYES can do a better job….most affordable…..open source….respects your freedom….. :) My mentors will be very happy to see this….:)

This week I also  worked on   setup of new experiment to measure velocity of sound in different media. We have mentioned this expt in our GSoC proposal. I have an idea to do this for solids but to find velocity  of sound in liquids appears very difficult.

To Do next week …..
These are incomplete tasks from the current week…I will work on these important things.

  • GUI for experiments with Friction
  • GUI for Doppler Effect
  • Documentation for all these Experiments
  • Python Code for a separate GUI for Plotting data from all channels of ExpEYES.

Tuesday, 01 July 2014

For accessing Data from all channels of ExpEYES we need a GUI which can plot graphs, something like a data logger. Today I started working on python code to develop a GUI to assess channels A1, A2, IN1, IN2 and SEN. Used the program written by Dr. Ajith Kumar as the base and started developing the code. Spent a lot of time …..happy that the result is awesome…..

datacapture

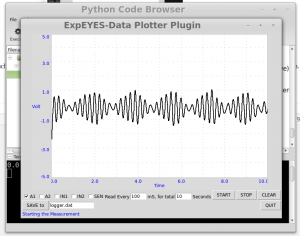
One strange thing is happening. If I touch a wire attached to A1. I am getting a waveform similar to beats in sound. Need to explore and find the reason.

beatslike wave

With this GUI we can fetch data from any channel and save it to a dat file and see the plot in real time. It is time to forget all costly and closed source dataloggers…..ExpEYES can do a better job….most affordable…..open source….respects your freedom….. 🙂 My mentors will be very happy to see this….:)

Monday, 30th June 2014

Continued to do the experimental with Doppler Effect using a pizzo buzzer as a source and a simple mic as a detector. Facing difficulties is calculating apparent frequency in case of oscillating source.

It is easy to calculate Doppler frequency shift in case of a source moving with constant velocity. Both the experimental setups are ready. Created a draft document for experimental procedures. Need to review and finalize the document. Also worked on the required python code to fetch data from detector and get the Doppler Shift.


GSoC Weekly Report 6

The previous week ( From Monday 23rd to Sunday, 29th June 2014) we could setup some new experiments to study the phenomena of Friction and sound.

Submitted the midterm evaluation on June 25th. On 28th midnight at 12.45 am…..got the happiest news that I have successfully passed the Google Summer of Code 2014 – Midterm Evaluation….. awesome moment I was waiting for….. Thanks a million to my mentors for all the guidance, help and encouragement.

Also received message from Payoneer that they have processed my GSoC payment. Now I can order some equipments Like Audio Frequency Oscilloscope and amplifiers for my Project. These equipments will help me to try the experiments and achieve the same with ExpEYES later.

Things We Could Do….

  • Setup an experiment to obtain Lissajous Figures using Square waves with various values of phase difference. Repeated the experiment with sine waves. Phase difference can be added with a capacitor and resistor circuit.
  • Started working on an experimental setup to produce these pattern in 3 Dimensions using Laser and Speakers.
  • Submitted the midterm evaluation report.
  • Completed the  set-up of a mechanics experiment to study conservation of momentum.  Wrote  python code to get the data.
  • Designed an instrument using  a  pulley and a photo-gate to measure acceleration. ( thanks to open educational resources for the idea..)This can be used  for different experiments involving friction.
  • In an experiment  to study oscillations of a loaded spring, we could obtain position time data and plot graph.To determine the spring constant of the given spiral spring we need to measure frequency and time periodic time.I could get this done by fitting the data by using a python code.
  • Set-up for demonstration of Doppler effect is ready. I used A buzzer attached to a spiral spring and made it oscillate in-front of the mic.
  • Prepared the experimental set-up For Doppler Effect. I have used the linear air track and fixed the source of sound on the glider. the emitted sound waves can be detected by a microphone fixed in ExpEYES. We can determine the original frequency of the source using ExpEYES and then the source is set in to motion and again frequency is determined.  A photo-gate is used to measure the speed of the source.
Things To Do Next Week….
  • GUI for experiments with Friction
  • GUI for Doppler Effect
  • Documentation for all these Experiments
  • Python Code for a separate GUI for Plotting data from all channels of ExpEYES.


Sunday, 29th June 2014

Since yesterday I am working on setting up of an experiment to study Doppler effect in sound.

If the source of sound or the detector is in motion relative to the medium of propagation, the frequency of the waves that are emitted  appears to be changed due to Doppler Effect. This is an interesting experiment at Higher Secondary level.

The experimental set-up is ready. I have used the linear air track and fixed the source of sound on the glider. the emitted sound waves can be detected by a microphone fixed in ExpEYES. We can determine the original frequency of the source using ExpEYES and then the source is set in to motion and again frequency is determined.  A photo-gate is used to measure the speed of the source.

The apparent frequency is related to the speed and the original frequency. The experimental results can be verified by theoretical calculations.

Practical Application:

  1. General Study of Doppler Effect
  2. For different frequencies, measure the Doppler shift with different velocities of the sound emitter. Compare the theoretical and experimental results.


The python code required for measuring frequency and also to determine speed using photo-gate  is already written. I could get good results in my experimental trials.

Tomorrow I will work on developing a separate code for a simple GUI for this experiment.

Saturday, 28th June 2014

Today I started working on an interesting experiment in sound and Waves. It is very  difficult to do experiments involving Doppler Effect in conventional laboratory. But with the help of ExpEYES Doppler Effect can be Demonstrated very easily.

The experimental set-up for demonstration of Doppler effect is ready. We need a moving source relative to the detector. Detector is the simple mic inside ExpEYES. For getting  a source which is harmonically oscillating, I used A buzzer attached to a spiral spring and made it oscillate in-front of the mic.

First, the frequency of the emitted signal is measured at rest. Then, the frequency shift that is caused by the oscillating source is measured. this can easily demonstrate ‘the apparent change in the frequency due to Doppler Effect.

My next step is to develop a set-up to measure Doppler Shift in case of a moving source with constant velocity. For this I am planning to use my linear air track which is developed for mechanics experiments, so that the cost can be reduced.