
Coding …. coding and Coding…
Since yesterday I am working on Plotting Graphs.
Here are some screen shots of my trials
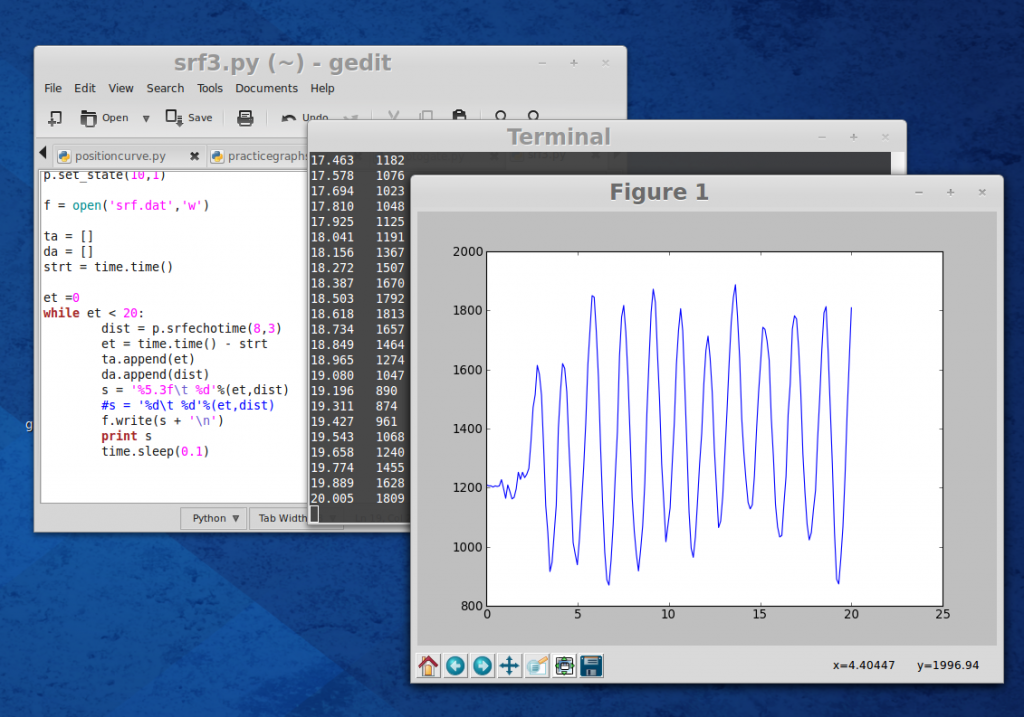
Data ( time and position) obtained from Ultrasonic sensor is stored in a file srf.dat and then plotted. I just moved a piece of paper to and fro, in-front of the sensor. Plot is reasonably good.
In another trial fetched data from the file and plotted….matplotlib is amazing … 🙂
 Need to debug the errors…..to get subplots…
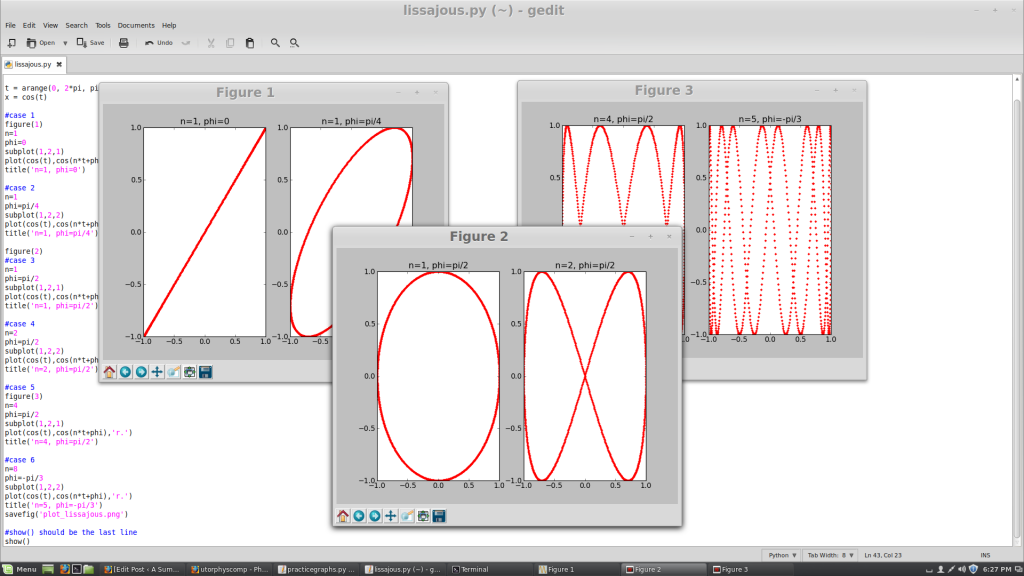
Also tried plotting Lissajous figures…..this code will be useful for my sound experiments…….beautiful yet simple….its python… 🙂
Coming week I will be focusing giving finishing touch to the experiments….
here is my git activity for today https://github.com/wavicles/Plugins-for-ExpEYES/commits/master