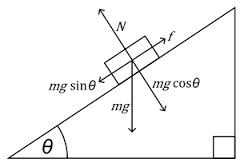
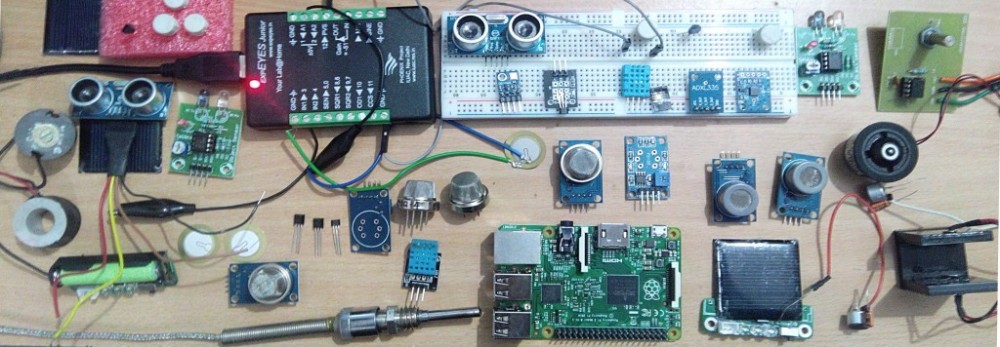
 This is a schematic diagram for the acceleration experiment I am working on.
Acceleration measured in this experiment is the sine component of ‘g’.
So now we can do this experiment by two methods.
- By using motion sensor …. the data is recorded with uniform time intervals.
- By using Photo-gates …… the time intervals are not uniform. time taken for traveling different distances can be measured and data can be used to calculate acceleration.
